• Skip to primary navigation
  • Skip to main content
  • Skip to primary sidebar
  • Get A Quote
  • 610.743.5602
  • Schedule A Meeting
default-logo
Menu
  • About
    • Team
    • Careers
    • Work
  • HubSpot Agency
    • Marketing Hub
      • Setup & Strategy
        • Inbound Success Plan
        • Inbound Marketing Plans
      • Traffic Generation
      • Lead Conversion
      • Lead Nurturing
    • Sales Hub
      • CRM Implementation
      • Sales Enablement
      • Sales & Marketing Alignment
    • Content Hub
  • Digital Marketing
    • Inbound Marketing
      • Inbound Marketing Plans
    • Content Marketing
    • Email Marketing
    • SEO
    • Social Media Marketing
    • PPC Management
  • Digital Analytics
  • Web Design
    • Shopify Web Design
    • CMS Hub
    • Branding/Graphic Design
    • Our Work
    • Hosting & Maintenance
  • Blog
    • Small & Mid-Sized Business Resources
    • Client Referral Program

Google Analytics

Social Media Advice Not To Follow

April 11, 2016 by Dabrian Marketing Group 1 Comment

When it comes to social media marketing and putting together a social strategy, there is a lot of social media advice out there, which may cause your head to spin. While some advice out there is relevant and your company should follow in that direction, there is some social media advice you should not follow. Below is some advice you may come across, but beware and make sure the advice you follow takes your company down the right path.

Social Media Advice Not to Follow

Your company should be on every social media platform

While this piece of advice may seem smart to you, you will want to think about if having a presence on every social media platform will truly make an impact on your business. Being present on each platform will take lots of time and upkeep, and could potentially require additional staff as well. Instead take a look at the demographics and find which platform your audience is on most, so you can start to create your social media presence and begin interacting and engaging with your audience.

You need to post on a schedule

Most companies believe that they need to post on a certain schedule. While schedules are great for a lot of things when it comes to business, social media is somewhat different.  Do research on the time of day your audience is responding to your posts and interacting with them.  The whole point of social media is engaging with your customers and potential customers.  Also posting on a schedule may make you company seem rigid and uptight.

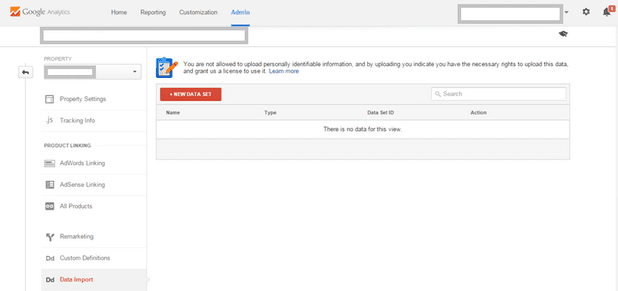
Followers are the only way to measure success

Your company may think a large amount of followers is the only way to measure success, but you may want to reassess how your company measures your social media success. The true ways to measure your success is by the engagement rate and with Google Analytics. By definition engagement rate is something you measure by looking at likes, shares, and comments. With Google Analytics, you can see what social media platforms, posts, or ads, are driving traffic to your website and measure success by what end goal your company sees fit.

You should delete negative comments

Instead of deleting any negative comments and trying to sweep them under the rug, people will look up to your company and even begin to trust your company when they see you responding to those comments in a mature way and owning up to them.

Everything needs to be about your brand

Your audience doesn’t always want to see everything your company has to offer or even every sale or promotion you have going on.  While social media is a great tool and you should put your sales and promotions on there, you will also want to give your followers and potential customer other valuable information relating to your industry and other information that they would find interesting.

For more information about Social Media Marketing and how we can help yours grow, contact us or leave us a comment below!

Filed Under: Google Analytics, Social Media Marketing & Management Tagged With: social media marketing

Tips for Enhanced Ecommerce Reporting with Google Analytics

March 14, 2016 by Daniel Laws Leave a Comment

Enhanced Ecommerce Reporting with Google Analytics

Good morning. My name is Daniel Laws, and I am the Principal Owner of DaBrian Marketing Group, an advertising agency in Reading, PA. I’ve been fielding a few questions around Enhanced Ecommerce reporting with Google Analytics. Today, what I want to talk about is exactly that, Enhanced Ecommerce reporting with Google Analytics. What I’m going to address today is what it is, and first and foremost, how is it different from the existing reporting that’s there. Also, how do you set it up? When you should set it up, where to set it up, as well as who needs to be involved in setting up those elements. Why you should care. What’s the value for your business for you to have those pieces set up.

With that being said, I’d like to kick this off with a little bit of information. Don’t mind me. I’m looking at dual screens here where I’ll drag a few things in, and obviously try to show you what I can. Obviously because of confidentiality with some of our clients and showing you their Google Analytics, can’t necessarily do that, but I’ll do my best to make it as informative, and give you the appropriate resources, and also load this information to our blog so that you might be able to get links directly to the assets. With that being said, I’m going to kick this off. Bear with me one moment while I share my screen. First and foremost, what I want to talk about is what is Enhanced reporting. With that being said, we’ve got Enhanced reporting. What you can see here is Enhanced reporting is going to give you more granular information than what you would get typically from Google Analytics as it pertains to shopping behavior, performance behavior, sales, product performance, sales performance. Those types of components will be more informative to you.

I’m looking for the screenshot here of something that’s actually going to be of value. What you can see here in this particular area is that it’s able to give you information as far as shopping activity, where the abandonments are happening simply from the shopping behavior components, as far as adding things to the cart, abandonment from cart, abandonment from checkout, those types of pieces. It can give you more information as well but at a high-level, I think one of the things that you’re going to be able to see … I know you’re going to be able to see is the shopping behavior, as well as a number of other items that will help you to make better business decisions around what sales items are working, perhaps identifying opportunities to fix the site, what have you.

How is this different from AdWords Shopping? From an AdWords Shopping perspective, you’re going to get high level information as far as clicks. You’re going to get information as far as Ecommerce revenue, conversion rate, those types of things, cost per click, to be a little bit specific. It’s going to give you some of those components if you’re running shopping. Obviously, this is a blank scenario. That’s why I used it in a test environment, so to speak. Obviously, it’s going to give you that type of information within the reporting, which is uniquely different than what you’re going to get from an overview of shopping behavior types of components. Now, what we’re looking at is shopping related information, revenue affiliates, campaigns, transactions. Those types of things are going to populate within the shopping. As you can see, it’s rather different than the other components.

The other piece of this is how do you set it up. I think one of the best resources that are out there are … Obviously you’re going to want to go to the Enhanced Ecommerce reporting section. Again, I’ll put this link towards the conclusion of the video. You’re going to want to get that information around Enhanced reporting. How you set it up can be complicated. I don’t want to say it’s very complicated, but it can be complicated in some scenarios. You want to make sure you have the most up to date analytics component there. What I mean by that is if you take a look, if you’re not on the most up to date Google Analytics version, if you’re not on analytics.js, you will run into issues and will need to migrate. Again, this is the information that’s there. You’ll need to migrate to that. You do have two options. You can migrate in an existing component or you can create a new property. In most cases people are going to want to have some of that historical data, be able to look at it in one fell swoop. The migration can become a little bit cumbersome in order to make that happen. Perhaps at a later date I’ll be able to shed some light on that for you as well.

You want to make sure that you have a measurement plan, first and foremost, before you go on this. Why are you doing what you need to do in order to capture this information? What metrics and KPIs? How are you going to troubleshoot and validate everything that’s there? Looking at some of those high-level components within the measurement plan … I’m not going to get into the details. If you haven’t done or looked at a measurement plan, I would recommend that you take a look at Google Analytics Academy, which gives you a high level overview of a measurement plan and how to break that down. Make sure that you have all those metrics, those elements, goals and objectives lined out prior to implementing the Enhanced Ecommerce reporting with Google Analytics.

When should you set this up? In most cases, people are already going to have some type of data already established, some campaigns, things that you’re already doing. I would say as quickly as humanly possible. The reason why I say that is it’s going to shed some light on a number of different areas, as I eluded to earlier, and perhaps help you to identify some low hanging fruit. With that being said, you want to do it now. If you can’t do it now, do you schedule regular updates for Google Analytics in order to roll out new capabilities? When you roll out those updated capabilities, I think that is when you’re going to want to take a look at updating the code and implementing the necessary components.

The reason why I say that is that it goes back to what you’re going to want to enable first and foremost, the tracking capabilities in itself and turn on Enhanced reporting. One of the prerequisites for this, as you can see here, is to turn on that particular element. That is inside the Admin Console. Due to confidentiality, obviously, I won’t show you that right now. If you want to go to that particular area, you go into Google Analytics. You go to Admin, and then you navigate to the view area of Ecommerce Settings, enable that particular piece, and that should be able to help you with some of those elements. Obviously you want to save, and then you want to implement the appropriate tags. That’s where it goes back to the Google developer components of what needs to be there and establishing that plug-in. It’s a great resource for that type of information as far as impression data, product data, and action data, as far as what needs to be required within updating that code.

Perhaps the other option for when you should set this up is when you roll out new products, new site features, whatever it might be, is incorporating that into that roll out if you can’t get it out now. You’ve heard me talk a little bit about the code, and updating the code, and what do you need, and those types of things. The other piece of this is who needs to be involved. To some degree you’re going to need somebody with some programming skills, familiarity with Google Analytics code, so a web analyst or someone who can obviously read through some of the material and the reference materials within the guides, and assist with those elements. In general, that’s going to be a programmer, somebody with familiarity with JavaScript, HTML, CSS if necessary. That’s generally not often required. It’s usually JavaScript, HTML code, PHP, those types of things, depending upon what your site is built on.

Where does this information go? Obviously, what you need is a site, as I eluded to before, you need to enable this inside your Google Analytics as I showed you before. You’re also going to want to have access and administrative access to Google Analytics when you bring the necessary parties involved. You may opt to implement this from a Tag Manager perspective. For the purposes of right now, I would say test it, get it up in the test environment. If you have the appropriate Google Analytics configuration, you’ll generally have an unfiltered view, a master view, and in the test view, I would say get those elements up and running first and foremost. If you’re going to use Tag Manager, make sure that you’re utilizing something within a test environment with Tag Manager to populate that information. When I say Tag Manager, I’m referring to Google Tag Manager specifically.

Why should you care? Number one, it integrates with your Ecommerce site, which is uniquely different from the shopping campaigns. The shopping campaigns and AdWords are very specific to you utilizing shopping campaigns via Google Analytics, no more no less. With the Enhanced Ecommerce Shopping, will allow you to gauge opt in opt … Not necessarily opt-in but abandonment rate, check out issues, sales performance issues, as it pertains to your Ecommerce site without running a campaign in its entirety, or without the necessity to have to run a campaign, if that makes sense. With that being said, it gives you an opportunity to improve revenues, increase revenues, identify broken processes that are impacting conversion rates. Why are people abandoning the shopping process? Why are people not putting items in the cart? At the same time, identifying ways to improve the average order value and the efficiency of your marketing. Where does the efficiency of your marketing come in? Comes very much so into play with internal promotions, and order coupons, and being able to get that information within Enhanced Ecommerce reporting with Google Analytics.

One of the other pieces of this, as I eluded to, is obviously the checkout, the shopping behavior, the checkout behavior analysis, their performance, product performance, sales performance. There’s also the internal promotions, order, and coupons just to name a few others that are going to provide you with information on what is working, what products are moving, what sales are performing well, do you modify things, and being able to collect that information based upon the measurement plan that I had mentioned earlier, and looking at those core metrics and being very focused on the goals and objectives to be able to pull out those insights and to do something about it.

With that being said, what’s the value to your business? The Bottom line is this information is going to help you to increase sales and revenue. It’s going to help you to improve marketing efficiency. It’s going to help you to prioritize items that are going to impact growth. One of the things that we often see is you have business owners that are running their business themselves and are handling their Ecommerce site, or working with a vendor directly, or they’ve got a marketing manager that is all encompassing. You’ve got a huge organization where not all of the pieces are connected. Where do you prioritize what’s going to have the maximum impact on the business?

By implementing the Enhanced Ecommerce reporting with Google Analytics, it gives you the opportunity to prioritize that information more specifically, look at those low hanging fruits that can impact revenue and growth, and to make sure that you can allocate time with things that are going to have the maximum impact, as opposed to trying to tackle everything. In most cases, there’s a lot to tackle from an Ecommerce perspective. We’re talking about SEO. We’re talking about advertising, paid search, banner ads, shopping campaigns, remarketing, a number of different things from an Ecommerce perspective, and retail perspective is everything from inventory ads.

Where do you prioritize your time? I think by enabling Enhanced reporting, it gives you a little bit more visibility into that. It gives you better metrics and allows you to justify advertising spent. Listen to me again, allows you to justify advertising spent. Many times we’re spending money on SEO. We’re spending money on pay per click. We’re spending money on email campaigns. We’re able to see what’s generating revenues, what items are being bogged down. You can slice and dice that data by segment, by marketing tactics so to speak, whether it’s the source medium. From a Google Analytics perspective, allow you to slice and dice that information and look at that shopping information very specifically.

With that being said, what I’ll do is I’ll load some of these resources to our blog when the video is live, point you in a right direction. Perhaps at a later date, we can get a little bit more granular on implementation of the code. Maybe we’ll get our buddy, our resident programmer webmaster here, Brett, to actually walk through some of those components for you. With that being said, thank you very much. Hope it was useful. Please let us know if we can add anything else of value. Thank you very much.

Resources:

https://support.google.com/analytics/answer/6014841?

https://support.google.com/adwords/answer/3455481?https://developers.google.com/analytics/devguides/collection/upgrade/

Filed Under: Digital Analytics, Ecommerce & Retail Marketing, Google Analytics Tagged With: Analytics, eCommerce, Google Analytics, video, web analytics

6 Ecommerce & Retail Store Metrics to Improve Sales

February 1, 2016 by Daniel Laws Leave a Comment

Put Your Retail Metrics & Ecommerce Analytics Into Context

There are so many metrics to help businesses improve sales, but there is so little time for the VP of Marketing or Sales.  Let’s take a look at a few retail marketing metrics or ecommerce analytics to help you gauge success and improve your sales in-store & online.  I recommend that you look at these metrics in the context of your product categories, marketing tactics that lead to visitors, geography, and your types of customers.

Sign-ups or New Accounts to Grow Your Customer Base

The growth of new sign-ups and new accounts gives you an opportunity to nurture the customer relationships and to ask questions to improve the business’s ability to cross-sell or up-sell your existing customer base. It will give you more details on the demographics new accounts or new customers. Ask in-store and online customers to sign-up for your newsletter, coupons, and notifications on upcoming ecommerce promotions or retail store events.

6 Ecommerce & Retail Store Metrics to Improve Sales

Coupon Redemption Rate for Insights & Sales Revenue

You are offering customers discounts, coupon rates, or rebates but are they redeeming your offerings? Improving the redemption rates will provide insights into which incentives lead to more (profitable) customers, in-store visits, online visits, and increase overall sales revenues. You will also discover whether or not in-store or ecommerce discounts lead to higher average order/in-store purchase value. If you don’t already know the answer, run a test to gather the information to identify which components are helping to increase your revenue.

Percent of Assisted Revenue Contributing to Market Share (dollar)

Assisted Revenue is monetary value of sales a channel (Direct, Email, or Organic) assisted in earning the sale.  You want to know which marketing channels are contributing to the business’s revenue to guide the marketing budget allocation and future decision making. For example, if a customer initially comes to your website via paid search and later purchases directly on your website, you would attribute some of the sales to paid search as well as direct traffic. By identifying the marketing channel that is increasing the market share, you must use the information to evaluate opportunities to grow the market share while increase profitability. Start using the data import features within Google Analytics or Adobe Analytics for a complete picture of your retail marketing metrics or ecommerce analytics.

Average Order Value or Value Per Transaction for More Sales Revenue

You will generate more sales revenue by increasing your average order value or value per transaction. In addition, you will have insight into the Product SKUs and Product Categories that are increasing the overall value per transaction.  With information on Product SKUs and Categories, you can make recommendations to increase your profits and return on investment (ROI). Identify the best mix of products to maximize your profits.

Shopping Cart Abandonment Rate for Better Conversion Rates

You worked hard to get a new account and have given the new prospective customer a coupon, but the product is still sitting in the shopping cart.  Reducing your shopping cart abandonment rate means more sales and revenue.  So, work to get better conversion rates by identifying the sale process and simplify the process for your customers.

Conversion Rates That Go Beyond Just Transactions

You always want to increase sales transactions, but consider the process that customers take before making a purchase. It often includes downloading some information, clicking on product reviews, signing up for a newsletter, sharing a product via social media, searching onsite for product details and more.  You can and should capture this information as a conversion or an event, both online and in-store whenever possible.  Have an internal discussion on questions the business has and the metrics that help you get answers.

Want more information on retail marketing & ecommerce?  Subscribe to our RSS feed or our newsletter!

Filed Under: Adobe Analytics, Digital Analytics, Ecommerce & Retail Marketing, Google Analytics Tagged With: eCommerce

Are You Afraid of PPC Advertising?

October 28, 2015 by Justin Miller Leave a Comment

With Halloween in a few days, we want to look into why some small business are afraid to run PPC advertising campaigns. After taking a closer look at some of the spooky aspects of PPC, hopefully, you will find that it is not scary, but that Pay per Click is an opportunity to help you increase leads and sales for your business. Here are the top 3 reasons small business are afraid of PPC:

1. Scary Expensive or Scared of Wasting Marketing Budget

Sure you can set a daily and monthly budget to control cost, but that doesn’t mean that it is being used wisely. Did you know that you can schedule your PPC ads to only run during specific hours of the day to maximize the effectiveness of campaigns with limited budgets? In addition, there is geo-targeting for localized businesses, and device specific bidding if mobile or desktop traffic is more valuable for your business. If you are already running PPC, these are a few settings that you might want to check to ensure you are getting the most out of your campaigns.

PPC Advertising Halloween

2. Scary Results (or lack thereof)

As a digital marketing agency, we hear “PPC doesn’t/didn’t work for our company/industry.” Really? Are you sure? Before you dive into doing PPC advertising, set your goals and know how you are measuring success. Are you trying to generate phone calls, form submissions or online ecommerce sales? Whatever the end goal might be, set-up Conversion (or goal) tracking. This can be done within the PPC platform (Google AdWords, Bing Ads, etc.), but ideally it is set-up through web analytics (Google Analytics.) Connecting web analytics to your PPC will allow you to see beyond the basic Impression and Click data, and uncover if there is a problem with your landing page(s) or conversion funnel/process.

If you are already running PPC but are not currently tracking conversions, then this is something that you should set-up ASAP. We cannot imagine anything scarier than spending marketing dollars and having no way of knowing/measuring the return!

3. Scary Complicated and/or Too Time Consuming

Pay per Click may seem simple and easy at first, but there is a reason Google requires a person to pass 2 of 6 different PPC proficiency exams to earn their AdWords Certified status. To properly setup and manage an account one needs to know the ins and outs of the AdWords platform and understand how search (both paid and organic) works. While there are several tools available to help make monitoring and management easier, these are only tools. The person using the tools still needs the skills and know how to make the most out of the tools. For instance, a carpenter can do a lot more with a saw and hammer then a chef can.

If you don’t have the time to learn, set-up and manage your own PPC advertising, we highly recommend that you seek help from someone certified (Google AdWords or Bing Ads) to help manage your PPC. Before you seek the help of just anybody, make sure that you have FULL access to your account and that if for any reason you decide to fire/disconnect from them managing your PPC, that you get to keep your account. Because the second scariest thing we can think up is not having any insight/access to your own PPC account.

Even though PPC can be scary and be a daunting task for some companies, if you take the time to truly understand the value of PPC and its ability to gain leads and sales and reach potential customers, then there should be no reason to be afraid of PPC advertising.

Filed Under: Ecommerce & Retail Marketing, Google Analytics, Paid Search (PPC)

How to Import Cost Data

October 14, 2015 by Dabrian Marketing Group Leave a Comment

What Is Cost Data And How Can Importing Cost Data Help Your Business?

Importing cost data into Google Analytics means having efficient and accurate data which brings you up to speed with your costs and ad spend. Cost data is the data from different non-Google social media platforms that provides information on impressions, clicks, costs, keywords, ad group, campaign and much more. Importing cost data means saving your time and money. This is all important because it allows you to perform Return On Investment (ROI) analysis and compare campaign performance for all online advertising and marketing platforms in Google Analytics. There are also many other ways you can import cost data from multiple sources into Google Analytics. Manually importing the cost data into Google Analytics is a low-cost method with simple steps.

Google Analytics Data Set Setup

You first begin by going into Google Analytics and creating a data set type, name, and schema. The data set type is the type of data you want to import, in this case it will be cost data. The schema is the outline of the plan that joins the data you upload with the existing data. The schema helps translate the dimension and metric to something Google Analytics would be able to understand. In order to do this, you must have access to the account, property, and view (company name, division, and where you want your data to go) in Google Analytics. Once you have selected the account, property, and view (company name, division, and where you want your data to go) in which you wish to import your cost data to, then click on Admin. Once you click on Admin, under property, click on the label called Data Import. A new screen should pop up, allowing you to add a new data set.

There should be a red button that says  “+New Data Set,” click on it. Below is an example of where you should start to set up the data set. Now you will have to fill out the data set type, name, and schema. Once again, the schema helps translate the dimension and metric to something Google Analytics would be able to understand. Starting with the data set type, choose the type of data you would like to import. In this case, you are importing cost data, so you would choose cost data under Summary Data Import. Next, is putting in the data set details such as the name and views you want the data to be seen in. The final step would be setting the data set schema. To do this choose the columns that you want to import data for, such as Click, Cost, Source, etc. Now that you setup the data set within Google Analytics, you can move on to getting your cost data.

“This can help you organize, analyze and act upon this unified data view in ways that are better aligned with your specific and unique business needs.” - Google

Obtain Cost Data From Source

The second step is to get the cost data from the source (Bing Ads, Facebook Ads, etc.). Keep in mind it should be a CSV file. You can do this by logging in to Bing Ads or another source. The CSV file will most likely have columns that need to be excluded, which will be described in the upcoming steps. Now that you have the cost data from the source, you need to fix the format of the CSV file.

Match CSV file with data set schema

The third step is setting up the CSV file to match the data set schema you created in Google Analytics. A schema is the structure of the plan that joins the data you upload with the existing data. Impressions, Medium, Source, Clicks, and Cost are some example of what a schema consists of. However, if one was to simply import these figures into Google Analytics there would be an error. In order to make the schema match, you must translate it.Google Analytics needs to understand what metrics are included in your data, so in order to do this we need to translate the metrics. Below is an example of a correctly formatted header, it is an example of a schema. Anything extra added from this schema won’t work. To import data, Google Analytics looks for a match with the file you are importing. When a match is found, the dimension and metric values associated with that data set are added to the existing data. Then, the data is available to be seen and analyzed within Google Analytics. While formatting the CSV file, there are two important factors to remember. The first factor is: don’t forget to include the date of the cost data, it would be translated to “ga:date.” The date needs to be formatted so it is YYYYMMDD. Any other format of the date will cause an error. The second factor is: make sure that each column that is labeled is filled, there should be no empty rows and columns. Now that you have matched or translated the schema over to the CSV file, you can upload it to Google Analytics.

Upload file into Google Analytics

The fourth step is to upload the cost data (CSV file) into Google Analytics. In order to do this, go to Google Analytics and choose the account, property, and view you want to import the cost data into. Then under admin, click data import, click manage uploads on the data set you created to upload the cost data. Next, click upload file and then choose the file you wish to be uploaded into Google Analytics.

Status of Cost Data file

The fifth step is to check the status of the cost data. It will take about thirty seconds for the file to upload. It will first say pending. If it has successfully uploaded you should be able to see the completed status under the data set you have created. If there is a failed status, you should be able to see the errors you made. You can fix them in the CSV file and upload the cost data once again.

How to view imported Cost Data into Google Analytics

The sixth step is if and only when you have successfully uploaded the cost data into Google Analytics, and can now view it. In order to view it, in Google Analytics pick the account/property/view in which you uploaded the cost data and then go to reporting. To see the cost data in Google Analytics, on the left side of the screen there should be a sidebar with many options. Click on acquisition and then campaigns, and then finally cost analysis. Cost analysis should appear and hopefully you should be able to see the upload cost data under the source/medium you imported. If you don’t see your cost data listed, I would recommend setting the date in Google Analytics to the date that your cost data has been uploaded to. Otherwise, after the CSV file is uploaded you should be able to see the accurate cost data.

Conclusion

Importing cost data helps business professionals save time and efficiently analyze the data. Importing cost data can change the whole prospect of a business’s ROI and campaign performance while comparing it to other advertising and marketing platforms.

Start importing your cost data, save your time and money. Contact us today or leave us a comment below for more advice or information!

Filed Under: Digital Analytics, Google Analytics Tagged With: cost data, Google Analytics

Data Import Tools Review

September 9, 2015 by Dabrian Marketing Group Leave a Comment

What is Data Importing? 

Data Importing is a process that is extremely beneficial for your business. In this case, data importing is based on the concept of getting cost data from social media websites such as Twitter and/or Facebook into Google Analytics. These data import tools provide you an easier way to import your cost data. These tools can save you time and help your business grow!

How will these tools impact your business?

Do you know where your advertising spend is going? You should know the tools you can use to import data into Google Analytics, so you know where your advertising spend is going and know what ads and campaigns have positive returns. This will help you make quick and efficient decisions. Knowing what your options are, can help you decide what you need and what is important or best for your business. Although you can manually import data, there are other ways that can be less time-consuming, but costly. Each of these platforms are different and have special features, but which tool is right for your business?

Supermetrics 

Supermetric is a tool that lets you import advertising cost data from any external advertising sources into Google Analytics. You can schedule automatic daily uploads from Facebook Ads, Bing Ads, Twitter Ads, and Linkedin Ads or upload CSV files from any data source. You can also connect Supermetrics to Bing Ads or Facebook Ads and set an outgoing daily upload.This way the information from Bing Ads and Facebook Ads will automatically connect to Google Analytics through Supermetrics.

This means less work is required and no formatting needs to be done, which saves time. The benefits of this tool include importing your cost data, seeing your advertising cost, and measuring advertising Return On Investment (ROI) in Google Analytics. Supermetrics combines your advertising cost data with Google Analytics ecommerce and goal conversion metrics to see if your campaigns are paying off. The only con for this tool would be the cost associated to purchase it. To schedule automatic uploads for each social media platform, the cost is separate, so the cost for Bing Ads, Facebook Ads, and file uploads are all different. Supermetrics has many things to offer, but is it the right fit for your businesses needs?

NEXT Analytics

NEXT Analytics is a tool that imports advertising cost data from external advertising sources such as Bing Ads and Facebook Ads into Google Analytics. This allows you access to the reports of all your advertising costs and their effectiveness. NEXT Analytics processes or formats the CSV file of the cost data for you, but it doesn’t do it for you completely. In order to format the data completely, you would need to filter or fix the data yourself. The good news is that you would only have to do this once because all of your actions are recorded, which can then be automatically reinforced each time you want to import cost data into Google Analytics.

With this tool, you can upload any number of accounts to a single license. In this case, a single license would mean that NEXT Analytics would be entitled to that one computer, but if needed you can always transfer the license to another computer. The one factor that needs to be considered is that there is a limited number of times you can transfer the license. One opposing factor would be that you can only upload seven dimensions and ten metrics, and another is the cost associated to purchase it. The cost depends on how much data you import. This can be purchased monthly or annually. The good news is that with NEXT Analytics, you can replace previous uploads. This allows us to add up to 19 more uploads to the original data set, this is useful if you have a lot of data to upload. NEXT Analytics is one tool out of many to import your data into Google Analytics.

Analysis Engine 

Analysis Engine is a tool that helps you to import advertising cost data from external advertising sources such as Bing Ads and Facebook Ads into Google Analytics. It automatically syncs Bing Ads cost data into Google Analytics, and then automatically imports the cost data. In order to automatically import the cost data into Google Analytics, you have to connect Bing Ads to Analysis Engine and then connect Google Analytics to Analysis Engine. This tool can help you determine your ROI and Return on Assets (ROA), provide reporting on your cost benefit marketing efforts, and much more. The cost of the tool isn’t provided right away, but you can request a demo for more information. Analysis Engine has many features for you to use, could this be the tool you are looking for?

Analytics Canvas 

Analytics Canvas is a tool that imports cost data from external advertising sources such as Bing Ads into Google Analytics. It allows you to check your marketing spend across multiple sources and campaigns. It can automatically link and import your cost data to Google Analytics if you have connected it to Bing Ads or another source. Analytics Canvas lets reports be automated, so it can be refreshed every day. This provides you with the information you will need, and it is easily accessible. One con of this platform or tool may be the cost. Depending on what features you may need, the cost will vary. Analysis Canvas has additional features that may interest you, but may hinder you because they are not needed or necessary for your business.

Analytics-Toolkit

Analytics-Toolkit is a platform that lets you import cost data from external advertising sources into Google Analytics. However, Analytics-Toolkit may limit your prospects. You have to manually get the cost data (CSV file) from the source (Bing Ads, Facebook Ads, etc.) and then use Analytics-Toolkit to upload and format the data. One issue that can come up is that the data is limited to a 90-day time period. Additionally, the cost can vary, but is relatively lower than most tools that help assist with importing cost data. Analytics-Toolkit is one of many options to choose from, but is it your cup of tea?

The great benefit of having a tool to import your cost data is that it allows you to adjust where your spend is going. Knowing what tools you can use to import data into Google Analytics can help you decide what fits your business best needs and how it will help your business grow, gain sales, and customers.

Start using these tools to import your data, check and see which tools best fits your needs. Contact us today or leave us a comment below for more advice or information!    

Filed Under: Digital Analytics, Ecommerce & Retail Marketing, Google Analytics Tagged With: Data Import Tools, Google Analytics

  • « Go to Previous Page
  • Page 1
  • Page 2
  • Page 3
  • Page 4
  • Interim pages omitted …
  • Page 9
  • Go to Next Page »

Primary Sidebar

Archives

Categories

Subscribe Now


CONTACT INFORMATION

DaBrian Marketing Group
3535 N. 5th Street HWY
Suite 2, #203
Reading, PA, 19605

  • 610.743.5602
  • Mon - Fri: 9AM - 5PM
Contact Us
Web Support

RESOURCES

  • Case Studies
  • White Papers
  • eBooks
  • Small Business Resources
  • Our Blog

MARKETING

  • Financial Services
  • Health & Wellness
  • Ecommerce & Retail
  • Business 2 Business
  • Business 2 Consumer

VISIT OUR LOCATION

  • Get Map & Directions

CONNECT WITH US

Facebook Instagram Linkedin Rss Twitter Youtube

Copyright © 2025 DaBrian Marketing Group  •  All Rights Reserved  •  Privacy Policy

Scroll Up